

Mapping Crime Data
National Incident Based Reporting System

The Federal Bureau of Investigation collects crime data via the National Incident Based Reporting System(NIBRS). New Hampshire is one of 15 states that submit all statewide data via the NIBRS. The most recent data available for download is from 2018. The data became available on September 30, 2019. Each year the data is released in the fall for the previous year. The data reflects 184 of the 205 law enforcement agencies in the State of New Hampshire.
There are 5 categories for reporting law enforcement agencies (State Police, County Sheriff, City and Town Police, Universities, and Other. There is only one “university” law enforcement agency reporting (University of New Hampshire) and only one “other” law enforcement agency reporting (New Hampshire Liquor Commission). Next is a brief overview of the 3 remaining law enforcement agencies reporting in the State of New Hampshire.
New Hampshire State Police Reporting
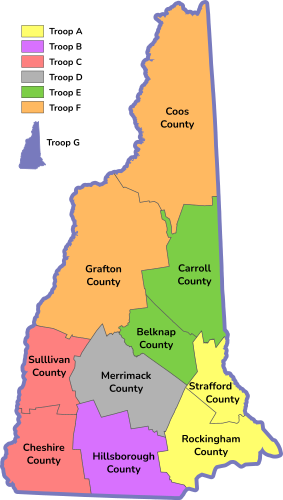
State Police County Level Reporting
- ID# 11887 (Troop F): Coos County State Police
- ID# 11902 (Troop F): Grafton County State Police
- ID# 11844 (Troop E): Carroll County State Police
- ID# 11830 (Troop E): Belknap County State Police
- ID# 12055 (Troop C): Sullivan County State Police
- ID# 11861 (Troop C): Cheshire County State Police
- ID# 12038 (Troop A): Strafford County State Police
- ID# 11998 (Troop A): Rockingham County State Police
- ID# 11934 (Troop B): Hillsborough County State Police
- ID# 11968 (Troop D): Merrimack County State Police
New Hampshire County Sheriff’s Reporting
There are 6 County Sheriff Offices reporting criminal incidents to the FBI’s Uniform Crime Reporting National Incident Based Reporting System. For those non-reporting areas you can review State Police and/or city and town agencies.
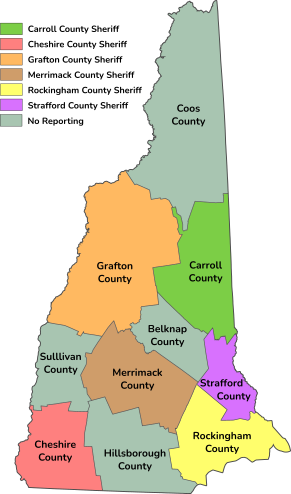
County Sheriff Level Reporting
- ID# 11901 : Grafton County Sheriff
- ID# 11843 : Carroll County Sheriff
- ID# 11860 : Cheshire County Sheriff
- ID# 11967: Merrimack County Sheriff
- ID# 11997: Rockingham County Sheriff
- ID# 12037: Strafford County Sheriff
Non-reporting County Sheriff Offices: Coos County Sheriff, Belknap County Sheriff, Sullivan County Sheriff, Hillsborough County Sheriff. The County Sheriff’s responsibilities don’t include day to day patrol. I have included links to the county sheriff websites that describe their day to day responsibilities.
New Hampshire City and Town Level Reporting
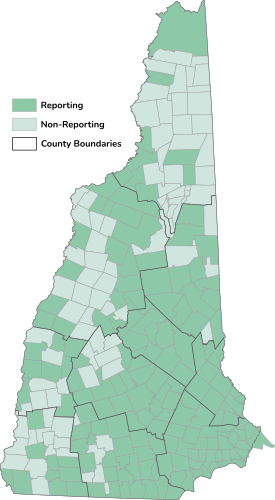
City and Town Level Reporting
The most recent American Community Survey (ACS) lists 260 county subdivisions of which 19 have no residents. We have included the most recent population, income, poverty, and unemployment numbers below for all county subdivisions listed by the United States Census for 2018. The census data has been included in the interactive online GIS applications referenced in this article.
You can visit the State of New Hampshire landing page for a summary of (234 communities) city and town websites. For example, take a moment and visit Greenfield, NH Police Department. It is one of 205 law enforcement agencies in the State. Greenfield, NH is a non-reporting town as of 2018.
| Agency ID | Agency Name | County |
|---|---|---|
| 11831 | Alton Police Department | Belknap County |
| 11832 | Barnstead Police Department | Belknap County |
| 11833 | Belmont Police Department | Belknap County |
| 11834 | Center Harbor Police Department | Belknap County |
| 11835 | Gilford Police Department | Belknap County |
| 11836 | Gilmanton Police Department | Belknap County |
| 11837 | Laconia Police Department | Belknap County |
| 11838 | Meredith Police Department | Belknap County |
| 11839 | New Hampton Police Department | Belknap County |
| 11840 | Sanbornton Police Department | Belknap County |
| 11841 | Tilton Police Department | Belknap County |
| 11845 | Bartlett Police Department | Carroll County |
| 11847 | Conway Police Department | Carroll County |
| 11848 | Effingham Police Department | Carroll County |
| 11850 | Jackson Police Department | Carroll County |
| 11849 | Freedom Police Department | Carroll County |
| 11851 | Madison Police Department | Carroll County |
| 11852 | Moultonborough Police Department | Carroll County |
| 11853 | Ossipee Police Department | Carroll County |
| 11854 | Sandwich Police Department | Carroll County |
| 11855 | Tamworth Police Department | Carroll County |
| 11856 | Tuftonboro Police Department | Carroll County |
| 11858 | Wolfeboro Police Department | Carroll County |
| 11862 | Alstead Police Department | Cheshire County |
| 11864 | Dublin Police Department | Cheshire County |
| 11868 | Hinsdale Police Department | Cheshire County |
| 11869 | Jaffrey Police Department | Cheshire County |
| 11870 | Keene Police Department | Cheshire County |
| 11875 | Rindge Police Department | Cheshire County |
| 11881 | Troy Police Department | Cheshire County |
| 11884 | Winchester Police Department | Cheshire County |
| 11888 | Berlin Police Department | Coos County |
| 11889 | Carroll Police Department | Coos County |
| 11890 | Colebrook Police Department | Coos County |
| 11891 | Dalton Police Department | Coos County |
| 11894 | Lancaster Police Department | Coos County |
| 11896 | Northumberland Police Department | Coos County |
| 27591 | Pittsburg Police Department | Coos County |
| 11903 | Alexandria Police Department | Grafton County |
| 11908 | Bristol Police Department | Grafton County |
| 11909 | Campton Police Department | Grafton County |
| 11912 | Enfield Police Department | Grafton County |
| 11913 | Franconia Police Department | Grafton County |
| 11915 | Hanover Police Department | Grafton County |
| 11916 | Haverhill Police Department | Grafton County |
| 11919 | Lebanon Police Department | Grafton County |
| 11920 | Lincoln Police Department | Grafton County |
| 11921 | Lisbon Police Department | Grafton County |
| 11922 | Littleton Police Department | Grafton County |
| 11925 | Orford Police Department | Grafton County |
| 11926 | Plymouth Police Department | Grafton County |
| 11927 | Sugar Hill Police Department | Grafton County |
| 11928 | Thornton Police Department | Grafton County |
| 11930 | Waterville Valley Police Department | Grafton County |
| 11931 | Woodstock Police Department | Grafton County |
| 11936 | Antrim Police Department | Hillsborough County |
| 11937 | Bedford Police Department | Hillsborough County |
| 11938 | Bennington Police Department | Hillsborough County |
| 11939 | Brookline Police Department | Hillsborough County |
| 11942 | Goffstown Police Department | Hillsborough County |
| 11945 | Hancock Police Department | Hillsborough County |
| 11946 | Hillsborough Police Department | Hillsborough County |
| 11947 | Hollis Police Department | Hillsborough County |
| 11948 | Hudson Police Department | Hillsborough County |
| 11949 | Litchfield Police Department | Hillsborough County |
| 11950 | Lyndeborough Police Department | Hillsborough County |
| 11953 | Merrimack Police Department | Hillsborough County |
| 11958 | New Ipswich Police Department | Hillsborough County |
| 11971 | Boscawen Police Department | Merrimack County |
| 11972 | Bow Police Department | Merrimack County |
| 11973 | Bradford Police Department | Merrimack County |
| 11974 | Canterbury Police Department | Merrimack County |
| 11976 | Concord Police Department | Merrimack County |
| 11979 | Epsom Police Department | Merrimack County |
| 11981 | Henniker Police Department | Merrimack County |
| 11983 | Hooksett Police Department | Merrimack County |
| 11984 | Hopkinton Police Department | Merrimack County |
| 11985 | Loudon Police Department | Merrimack County |
| 11986 | Newbury Police Department | Merrimack County |
| 11987 | New London Police Department | Merrimack County |
| 11988 | Northfield Police Department | Merrimack County |
| 11994 | Webster Police Department | Merrimack County |
| 11999 | Atkinson Police Department | Rockingham County |
| 12000 | Auburn Police Department | Rockingham County |
| 12001 | Brentwood Police Department | Rockingham County |
| 12002 | Candia Police Department | Rockingham County |
| 12003 | Chester Police Department | Rockingham County |
| 12004 | Danville Police Department | Rockingham County |
| 12005 | Deerfield Police Department | Rockingham County |
| 12006 | Derry Police Department | Rockingham County |
| 12007 | East Kingston Police Department | Rockingham County |
| 12011 | Greenland Police Department | Rockingham County |
| 12012 | Hampstead Police Department | Rockingham County |
| 12014 | Hampton Falls Police Department | Rockingham County |
| 12015 | Kensington Police Department | Rockingham County |
| 12016 | Kingston Police Department | Rockingham County |
| 12017 | Londonderry Police Department | Rockingham County |
| 12019 | Newfields Police Department | Rockingham County |
| 12020 | Newington Police Department | Rockingham County |
| 12021 | Newmarket Police Department | Rockingham County |
| 12025 | Nottingham Police Department | Rockingham County |
| 12026 | Plaistow Police Department | Rockingham County |
| 12027 | Portsmouth Police Department | Rockingham County |
| 12028 | Raymond Police Department | Rockingham County |
| 12029 | Rye Police Department | Rockingham County |
| 12030 | Salem Police Department | Rockingham County |
| 12031 | Sandown Police Department | Rockingham County |
| 12032 | Seabrook Police Department | Rockingham County |
| 12034 | Stratham Police Department | Rockingham County |
| 12035 | Windham Police Department | Rockingham County |
| 12039 | Barrington Police Department | Strafford County |
| 12040 | Dover Police Department | Strafford County |
| 12041 | Durham Police Department | Strafford County |
| 12042 | Farmington Police Department | Strafford County |
| 12043 | Lee Police Department | Strafford County |
| 12044 | Madbury Police Department | Strafford County |
| 12045 | Middleton Police Department | Strafford County |
| 12046 | Milton Police Department | Strafford County |
| 12047 | New Durham Police Department | Strafford County |
| 12048 | Rochester Police Department | Strafford County |
| 12049 | Rollinsford Police Department | Strafford County |
| 12050 | Somersworth Police Department | Strafford County |
| 12051 | Strafford Police Department | Strafford County |
| 12057 | Charlestown Police Department | Sullivan County |
| 12058 | Claremont Police Department | Sullivan County |
| 12070 | Cornish Police Department | Sullivan County |
| 12061 | Grantham Police Department | Sullivan County |
| 12064 | Newport Police Department | Sullivan County |
| 12066 | Springfield Police Department | Sullivan County |
| 12067 | Sunapee Police Department | Sullivan County |
| 12069 | Washington Police Department | Sullivan County |
| 12033 | South Hampton Police Department | Rockingham County |
| 11857 | Wakefield Police Department | Carroll County |
| 11865 | Fitzwilliam Police Department | Cheshire County |
| 11871 | Marlborough Police Department | Cheshire County |
| 11893 | Gorham Police Department | Coos County |
| 11904 | Ashland Police Department | Grafton County |
| 11906 | Bethlehem Police Department | Grafton County |
| 11917 | Holderness Police Department | Grafton County |
| 11935 | Amherst Police Department | Hillsborough County |
| 11940 | Deering Police Department | Hillsborough County |
| 11951 | Manchester Police Department | Hillsborough County |
| 11959 | Pelham Police Department | Hillsborough County |
| 11954 | Milford Police Department | Hillsborough County |
| 11955 | Mont Vernon Police Department | Hillsborough County |
| 11956 | Nashua Police Department | Hillsborough County |
| 11957 | New Boston Police Department | Hillsborough County |
| 11960 | Peterborough Police Department | Hillsborough County |
| 11963 | Weare Police Department | Hillsborough County |
| 11964 | Wilton Police Department | Hillsborough County |
| 11978 | Dunbarton Police Department | Merrimack County |
| 11980 | Franklin Police Department | Merrimack County |
| 11989 | Pembroke Police Department | Merrimack County |
| 11993 | Warner Police Department | Merrimack County |
| 12008 | Epping Police Department | Rockingham County |
| 12009 | Exeter Police Department | Rockingham County |
| 12010 | Fremont Police Department | Rockingham County |
| 12013 | Hampton Police Department | Rockingham County |
| 12022 | Newton Police Department | Rockingham County |
| 12023 | North Hampton Police Department | Rockingham County |
| 12024 | Northwood Police Department | Rockingham County |
| 11969 | Allenstown Police Department | Merrimack County |
| 11975 | Chichester Police Department | Merrimack County |
| 11990 | Pittsfield Police Department | Merrimack County |
| 11952 | Mason Police Department | Hillsborough County |
| 12018 | New Castle Police Department | Rockingham County |
| 11899 | Whitefield Police Department | Coos County |
Crime Rate Calculation
A crime rate describes the number of crimes reported to law enforcement agencies per 100,000 total population. A crime rate is calculated by dividing the number of reported crimes by the total population; the result is multiplied by 100,000. For example, in 2018 there were 614 violent crimes in Manchester New Hampshire and the population was 111,422. This equals a violent crime rate of 551 per 100,000 general population. Another example, in 2018 there were 13 violent crimes in Campton New Hampshire and the population was 3,281. This equals a violent crime rate of 396 per 100,000 general population. Below are the examples of each calculation.
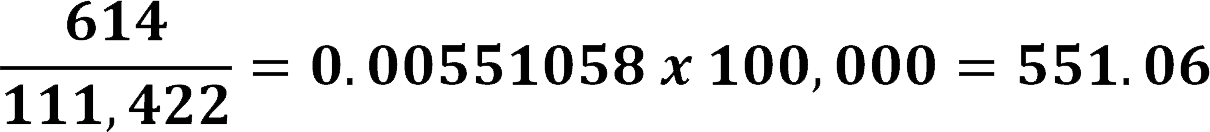
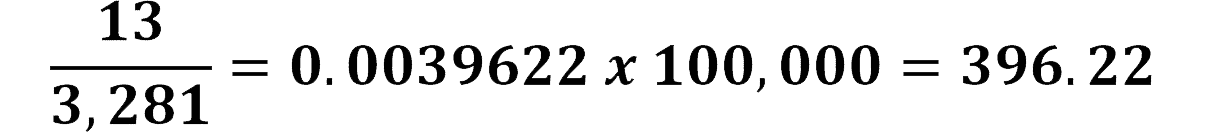
The United States violent crime rate for robbery in 2018 was 380.6 (Per 100,000 general population). For the two examples noted above, Manchester and Campton are both higher than the national average. The violent crime rate is the most widely referenced and is comprised of incidents of rape, robbery, homicide, and aggravated assault. The NIBRS data was downloaded, summarized, formatted and joined with each agency’s location within the State of New Hampshire. Although the State of New Hampshire is one of only three states to report fewer than 200 violent crimes in 2018, there are communities within the State of New Hampshire that are higher than the United States violent crime rate.
We included variables such as population density, median household income, poverty and unemployment rates that could provide some insight into why those communities are higher than the national average. There are many other variables that law enforcement takes into account at the county or town level that crime analysts use to assist them in reducing crime in their communities. The majority of the incident data is provided at the city/town level and does not include the actual address of the incident. Some communities are now including the location using the latitude and longitude of the incident and providing the data to the public (available for download). This provides the ability to perform “Hot Spot” analysis and drill down to the neighborhood level.
There were more than 1.2 million incidents of rape, robbery, aggravated assault, and murder reported in the United States in 2018 – a 3% decline from the previous year. The decrease in violent crime represents the continuation of a long-term trend. The U.S. violent crime rate stands at 381 incidents per 100,000 people, down from a high of 758 per 100,000 in 1991.
USA Today
The following tables summarize violent and property crime incidents for the State of New Hampshire. An incident represents a “single” incident in the NIBRS database. There can be up to 10 offenses, 99 offenders, and 999 victims associated with each incident. Take a moment a explore the Web GIS applications to see the number of crimes reported in each community.
State of New Hampshire Violent and Property Crime Incidents 2018
New Hampshire Crime Rate 2018
| Violent Crime | Incidents |
|---|---|
| Rape | 522 |
| Homicide | 19 |
| Robbery | 337 |
| Aggravated Assault | 1,291 |
| Total | 2,169 |
| Property Crime | Incidents |
|---|---|
| Arson | 118 |
| Burglary | 1,840 |
| Larceny Theft | 14,041 |
| Motor Vehicle Theft | 877 |
| Total | 16,876 |
There were 64 “Offense Type Codes” listed in New Hampshire NIBRS database of which 51 had at least one incident was recorded for 2018. The application on the lower left lists all reported crimes for each offense type code and summarizes the incidents by offense. For example Larceny/Theft Offenses consists of 9 different offense type codes. The application on the lower right gives the user the ability to look and compare the violent and property crime rates for each community. The user can also view a few examples of individual offenses and where the majority of incidents are located within the state.
Since crime is a sociological phenomenon influenced by a variety of factors, the FBI discourages ranking locations or making comparisons as a way of measuring law enforcement effectiveness. Some of this data may not be comparable to previous years because of differing levels of participation over time.
FBI
The following tables are examples of the most recent American Community Survey (ACS) data that was used in the GIS applications noted above. The tables allow you to search the entire table or sort each column for a community of interest. Both table headings provide links to learn more about the American Community Survey program run by the United States Census
ACS 2018 Population
| Town | County | Total Population | Male Population | Female Population | Population% (<18) | Population% (>65) | Population% (<18 and >65) |
|---|---|---|---|---|---|---|---|
| Acworth | Sullivan County | 930 | 497 | 433 | 12.80% | 29.35% | 42.15% |
| Albany | Carroll County | 772 | 390 | 382 | 22.28% | 17.10% | 39.38% |
| Alexandria | Grafton County | 2,005 | 1,033 | 972 | 19.05% | 18.05% | 37.11% |
| Allens | Merrimack County | 4,370 | 2,216 | 2,154 | 19.24% | 14.46% | 33.71% |
| Alstead | Cheshire County | 1,736 | 787 | 949 | 17.45% | 26.09% | 43.55% |
| Alton | Belknap County | 5,298 | 2,629 | 2,669 | 22.16% | 24.24% | 46.39% |
| Amherst | Hillsborough County | 11,310 | 5,494 | 5,816 | 24.85% | 17.21% | 42.05% |
| Andover | Merrimack County | 2,799 | 1,531 | 1,268 | 22.97% | 15.93% | 38.91% |
| Antrim | Hillsborough County | 2,680 | 1,363 | 1,317 | 22.31% | 15.78% | 38.10% |
| Ashland | Grafton County | 2,142 | 948 | 1,194 | 20.21% | 19.33% | 39.54% |
| Atkinson | Rockingham County | 6,897 | 3,437 | 3,460 | 19.47% | 19.81% | 39.28% |
| Atkinson and Gilmanton Academy grant | Coos County | 0 | 0 | 0 | 0.00% | 0.00% | 0.00% |
| Auburn | Rockingham County | 5,385 | 2,690 | 2,695 | 19.72% | 13.87% | 33.59% |
| Barnstead | Belknap County | 4,624 | 2,163 | 2,461 | 21.47% | 11.51% | 32.98% |
| Barrington | Strafford County | 8,979 | 4,576 | 4,403 | 22.06% | 8.56% | 30.63% |
| Bartlett | Carroll County | 2,761 | 1,492 | 1,269 | 10.11% | 28.58% | 38.68% |
| Bath | Grafton County | 914 | 491 | 423 | 18.82% | 28.12% | 46.94% |
| Beans grant | Coos County | 0 | 0 | 0 | 0.00% | 0.00% | 0.00% |
| Beans purchase | Coos County | 0 | 0 | 0 | 0.00% | 0.00% | 0.00% |
| Bedford | Hillsborough County | 22,388 | 10,822 | 11,566 | 25.25% | 16.53% | 41.78% |
| Belmont | Belknap County | 7,298 | 3,472 | 3,826 | 20.54% | 13.94% | 34.48% |
| Bennington | Hillsborough County | 1,402 | 747 | 655 | 22.25% | 16.33% | 38.59% |
| Benton | Grafton County | 395 | 200 | 195 | 6.33% | 45.57% | 51.90% |
| Berlin | Coos County | 10,382 | 5,860 | 4,522 | 15.38% | 18.96% | 34.34% |
| Bethlehem | Grafton County | 2,568 | 1,224 | 1,344 | 16.98% | 19.78% | 36.76% |
| Boscawen | Merrimack County | 4,029 | 1,871 | 2,158 | 19.66% | 21.59% | 41.25% |
| Bow | Merrimack County | 7,816 | 3,961 | 3,855 | 24.67% | 16.89% | 41.56% |
| Bradford | Merrimack County | 1,633 | 827 | 806 | 20.39% | 22.90% | 43.29% |
| Brentwood | Rockingham County | 4,712 | 2,527 | 2,185 | 25.85% | 13.41% | 39.26% |
| Bridgewater | Grafton County | 1,205 | 613 | 592 | 16.18% | 31.20% | 47.39% |
| Bristol | Grafton County | 3,063 | 1,610 | 1,453 | 17.01% | 19.03% | 36.04% |
| Brookfield | Carroll County | 709 | 370 | 339 | 18.05% | 24.68% | 42.74% |
| Brookline | Hillsborough County | 5,298 | 2,465 | 2,833 | 28.73% | 10.91% | 39.64% |
| Cambridge ship | Coos County | 0 | 0 | 0 | 0.00% | 0.00% | 0.00% |
| Campton | Grafton County | 3,313 | 1,675 | 1,638 | 16.06% | 17.93% | 33.99% |
| Canaan | Grafton County | 3,917 | 1,824 | 2,093 | 18.02% | 13.76% | 31.78% |
| Candia | Rockingham County | 3,925 | 2,016 | 1,909 | 18.29% | 16.10% | 34.39% |
| Canterbury | Merrimack County | 2,335 | 1,164 | 1,171 | 15.16% | 16.79% | 31.95% |
| Carroll | Coos County | 740 | 420 | 320 | 17.16% | 26.89% | 44.05% |
| Center Harbor | Belknap County | 995 | 524 | 471 | 13.17% | 26.73% | 39.90% |
| Chandlers purchase | Coos County | 0 | 0 | 0 | 0.00% | 0.00% | 0.00% |
| Charles | Sullivan County | 5,019 | 2,542 | 2,477 | 21.82% | 19.88% | 41.70% |
| Chatham | Carroll County | 370 | 180 | 190 | 20.00% | 22.97% | 42.97% |
| Chester | Rockingham County | 5,039 | 2,573 | 2,466 | 22.13% | 11.89% | 34.01% |
| Chesterfield | Cheshire County | 3,576 | 1,781 | 1,795 | 24.36% | 21.03% | 45.39% |
| Chichester | Merrimack County | 2,625 | 1,325 | 1,300 | 22.32% | 15.43% | 37.75% |
| Claremont | Sullivan County | 13,016 | 6,173 | 6,843 | 20.21% | 16.89% | 37.11% |
| Clarksville | Coos County | 339 | 177 | 162 | 10.03% | 21.53% | 31.56% |
| Colebrook | Coos County | 2,008 | 970 | 1,038 | 16.68% | 24.85% | 41.53% |
| Columbia | Coos County | 602 | 309 | 293 | 13.62% | 25.75% | 39.37% |
| Concord | Merrimack County | 43,040 | 21,566 | 21,474 | 19.29% | 15.75% | 35.04% |
| Conway | Carroll County | 10,078 | 5,055 | 5,023 | 20.40% | 20.92% | 41.32% |
| Cornish | Sullivan County | 1,813 | 939 | 874 | 22.45% | 24.77% | 47.21% |
| County Subdivisions Not Defined | Rockingham County | 0 | 0 | 0 | 0.00% | 0.00% | 0.00% |
| Crawfords purchase | Coos County | 0 | 0 | 0 | 0.00% | 0.00% | 0.00% |
| Croydon | Sullivan County | 972 | 422 | 550 | 18.21% | 12.86% | 31.07% |
| Cutts grant | Coos County | 0 | 0 | 0 | 0.00% | 0.00% | 0.00% |
| Dalton | Coos County | 982 | 465 | 517 | 12.83% | 21.28% | 34.11% |
| Danbury | Merrimack County | 1,177 | 576 | 601 | 18.44% | 14.70% | 33.14% |
| Danville | Rockingham County | 4,515 | 2,280 | 2,235 | 22.41% | 10.92% | 33.33% |
| Deerfield | Rockingham County | 4,463 | 2,218 | 2,245 | 19.96% | 15.10% | 35.07% |
| Deering | Hillsborough County | 1,958 | 1,028 | 930 | 19.15% | 15.63% | 34.78% |
| Derry | Rockingham County | 33,515 | 16,857 | 16,658 | 22.00% | 12.01% | 34.01% |
| Dixs grant | Coos County | 0 | 0 | 0 | 0.00% | 0.00% | 0.00% |
| Dixville ship | Coos County | 11 | 9 | 2 | 18.18% | 0.00% | 18.18% |
| Dorchester | Grafton County | 362 | 182 | 180 | 16.57% | 28.18% | 44.75% |
| Dover | Strafford County | 31,316 | 14,806 | 16,510 | 19.01% | 15.08% | 34.09% |
| Dublin | Cheshire County | 1,487 | 728 | 759 | 18.36% | 21.12% | 39.48% |
| Dummer | Coos County | 271 | 147 | 124 | 16.97% | 33.21% | 50.18% |
| Dunbarton | Merrimack County | 2,811 | 1,449 | 1,362 | 24.97% | 11.67% | 36.64% |
| Durham | Strafford County | 16,440 | 7,936 | 8,504 | 8.70% | 7.55% | 16.26% |
| East Kingston | Rockingham County | 2,445 | 1,245 | 1,200 | 21.88% | 18.24% | 40.12% |
| Easton | Grafton County | 259 | 114 | 145 | 4.63% | 28.19% | 32.82% |
| Eaton | Carroll County | 289 | 134 | 155 | 7.96% | 27.68% | 35.64% |
| Effingham | Carroll County | 1,537 | 706 | 831 | 21.93% | 18.22% | 40.14% |
| Ellsworth | Grafton County | 61 | 41 | 20 | 16.39% | 40.98% | 57.38% |
| Enfield | Grafton County | 4,570 | 2,120 | 2,450 | 12.54% | 20.07% | 32.60% |
| Epping | Rockingham County | 6,945 | 3,521 | 3,424 | 21.02% | 17.51% | 38.53% |
| Epsom | Merrimack County | 4,713 | 2,421 | 2,292 | 20.22% | 18.88% | 39.10% |
| Errol | Coos County | 234 | 117 | 117 | 11.97% | 33.76% | 45.73% |
| Ervings location | Coos County | 0 | 0 | 0 | 0.00% | 0.00% | 0.00% |
| Exeter | Rockingham County | 14,921 | 6,846 | 8,075 | 19.36% | 21.81% | 41.17% |
| Farmington | Strafford County | 6,884 | 3,633 | 3,251 | 20.76% | 13.81% | 34.57% |
| Fitzwilliam | Cheshire County | 2,351 | 1,235 | 1,116 | 17.95% | 20.76% | 38.71% |
| Frances | Hillsborough County | 1,650 | 832 | 818 | 19.33% | 19.03% | 38.36% |
| Franconia | Grafton County | 1,025 | 514 | 511 | 7.41% | 36.20% | 43.61% |
| Franklin | Merrimack County | 8,586 | 4,084 | 4,502 | 18.70% | 19.28% | 37.98% |
| Freedom | Carroll County | 1,353 | 674 | 679 | 13.45% | 32.82% | 46.27% |
| Fremont | Rockingham County | 4,667 | 2,351 | 2,316 | 19.63% | 15.81% | 35.44% |
| Gilford | Belknap County | 7,139 | 3,205 | 3,934 | 20.51% | 24.81% | 45.31% |
| Gilmanton | Belknap County | 3,738 | 1,881 | 1,857 | 20.73% | 20.33% | 41.06% |
| Gilsum | Cheshire County | 732 | 390 | 342 | 17.62% | 20.08% | 37.70% |
| Goffs | Hillsborough County | 18,062 | 8,601 | 9,461 | 19.48% | 15.71% | 35.20% |
| Gorham | Coos County | 2,636 | 1,366 | 1,270 | 15.97% | 22.69% | 38.66% |
| Goshen | Sullivan County | 772 | 399 | 373 | 22.80% | 22.02% | 44.82% |
| Grafton | Grafton County | 1,220 | 662 | 558 | 17.38% | 20.98% | 38.36% |
| Grantham | Sullivan County | 2,941 | 1,381 | 1,560 | 19.14% | 22.17% | 41.31% |
| Greenfield | Hillsborough County | 1,765 | 887 | 878 | 17.73% | 20.79% | 38.53% |
| Greenland | Rockingham County | 3,953 | 1,961 | 1,992 | 22.26% | 17.46% | 39.72% |
| Greens grant | Coos County | 12 | 12 | 0 | 0.00% | 0.00% | 0.00% |
| Greenville | Hillsborough County | 2,049 | 1,038 | 1,011 | 18.79% | 15.57% | 34.36% |
| Groton | Grafton County | 530 | 268 | 262 | 9.25% | 15.09% | 24.34% |
| Hadleys purchase | Coos County | 0 | 0 | 0 | 0.00% | 0.00% | 0.00% |
| Hale's location | Carroll County | 167 | 81 | 86 | 1.80% | 76.05% | 77.84% |
| Hampstead | Rockingham County | 8,625 | 4,214 | 4,411 | 21.30% | 18.23% | 39.52% |
| Hampton | Rockingham County | 15,452 | 7,383 | 8,069 | 14.57% | 24.38% | 38.95% |
| Hampton Falls | Rockingham County | 2,358 | 1,246 | 1,112 | 20.44% | 15.10% | 35.54% |
| Hancock | Hillsborough County | 1,785 | 846 | 939 | 17.98% | 29.02% | 47.00% |
| Hanover | Grafton County | 11,512 | 5,701 | 5,811 | 14.48% | 13.46% | 27.94% |
| Harrisville | Cheshire County | 921 | 473 | 448 | 10.31% | 32.57% | 42.89% |
| Hart's Location | Carroll County | 56 | 29 | 27 | 0.00% | 25.00% | 25.00% |
| Haverhill | Grafton County | 4,616 | 2,238 | 2,378 | 16.66% | 21.38% | 38.04% |
| Hebron | Grafton County | 580 | 307 | 273 | 12.07% | 41.38% | 53.45% |
| Henniker | Merrimack County | 4,950 | 2,401 | 2,549 | 16.67% | 13.76% | 30.42% |
| Hill | Merrimack County | 931 | 477 | 454 | 14.29% | 18.80% | 33.08% |
| Hillsborough | Hillsborough County | 5,999 | 3,105 | 2,894 | 26.14% | 15.47% | 41.61% |
| Hinsdale | Cheshire County | 3,917 | 2,044 | 1,873 | 19.02% | 17.92% | 36.94% |
| Holderness | Grafton County | 2,336 | 1,137 | 1,199 | 21.96% | 19.26% | 41.22% |
| Hollis | Hillsborough County | 7,880 | 4,175 | 3,705 | 23.40% | 15.93% | 39.33% |
| Hooksett | Merrimack County | 14,221 | 6,808 | 7,413 | 19.05% | 16.58% | 35.63% |
| Hopkinton | Merrimack County | 5,670 | 2,759 | 2,911 | 20.14% | 18.87% | 39.01% |
| Hudson | Hillsborough County | 25,185 | 12,092 | 13,093 | 20.97% | 15.85% | 36.82% |
| Jackson | Carroll County | 966 | 433 | 533 | 13.35% | 31.99% | 45.34% |
| Jaffrey | Cheshire County | 5,307 | 2,600 | 2,707 | 21.14% | 20.71% | 41.85% |
| Jefferson | Coos County | 941 | 443 | 498 | 15.62% | 22.21% | 37.83% |
| Keene | Cheshire County | 23,165 | 10,922 | 12,243 | 15.48% | 17.42% | 32.90% |
| Kensington | Rockingham County | 2,326 | 1,183 | 1,143 | 20.89% | 18.36% | 39.25% |
| Kilkenny ship | Coos County | 0 | 0 | 0 | 0.00% | 0.00% | 0.00% |
| Kingston | Rockingham County | 6,210 | 3,192 | 3,018 | 18.05% | 17.67% | 35.72% |
| Laconia | Belknap County | 16,342 | 7,952 | 8,390 | 16.41% | 21.82% | 38.23% |
| Lancaster | Coos County | 3,310 | 1,682 | 1,628 | 21.69% | 21.18% | 42.87% |
| Landaff | Grafton County | 450 | 200 | 250 | 14.67% | 24.22% | 38.89% |
| Langdon | Sullivan County | 829 | 400 | 429 | 29.07% | 13.99% | 43.06% |
| Lebanon | Grafton County | 13,619 | 6,736 | 6,883 | 18.39% | 18.94% | 37.32% |
| Lee | Strafford County | 4,424 | 2,191 | 2,233 | 18.40% | 17.00% | 35.40% |
| Lempster | Sullivan County | 906 | 437 | 469 | 20.42% | 18.54% | 38.96% |
| Lincoln | Grafton County | 1,229 | 658 | 571 | 17.49% | 16.52% | 34.01% |
| Lisbon | Grafton County | 1,631 | 818 | 813 | 19.25% | 15.70% | 34.95% |
| Litchfield | Hillsborough County | 8,538 | 4,536 | 4,002 | 23.60% | 13.86% | 37.46% |
| Littleton | Grafton County | 5,927 | 2,798 | 3,129 | 16.57% | 20.01% | 36.58% |
| Livermore | Grafton County | 0 | 0 | 0 | 0.00% | 0.00% | 0.00% |
| Londonderry | Rockingham County | 25,529 | 12,407 | 13,122 | 22.95% | 13.37% | 36.31% |
| Loudon | Merrimack County | 5,488 | 2,454 | 3,034 | 14.63% | 19.72% | 34.35% |
| Low and Burbanks grant | Coos County | 0 | 0 | 0 | 0.00% | 0.00% | 0.00% |
| Lyman | Grafton County | 651 | 332 | 319 | 10.91% | 22.12% | 33.03% |
| Lyme | Grafton County | 1,682 | 812 | 870 | 21.64% | 24.67% | 46.31% |
| Lyndeborough | Hillsborough County | 1,703 | 911 | 792 | 17.38% | 18.56% | 35.94% |
| Madbury | Strafford County | 1,867 | 969 | 898 | 29.41% | 9.80% | 39.21% |
| Madison | Carroll County | 2,545 | 1,236 | 1,309 | 18.55% | 22.83% | 41.38% |
| Manchester | Hillsborough County | 111,657 | 56,950 | 54,707 | 20.01% | 13.14% | 33.15% |
| Marlborough | Cheshire County | 2,271 | 1,153 | 1,118 | 16.86% | 20.78% | 37.65% |
| Marlow | Cheshire County | 813 | 404 | 409 | 24.35% | 16.97% | 41.33% |
| Martins location | Coos County | 0 | 0 | 0 | 0.00% | 0.00% | 0.00% |
| Mason | Hillsborough County | 1,540 | 744 | 796 | 20.26% | 14.94% | 35.19% |
| Meredith | Belknap County | 6,369 | 3,258 | 3,111 | 19.80% | 25.00% | 44.80% |
| Merrimack | Hillsborough County | 25,815 | 13,050 | 12,765 | 21.29% | 13.74% | 35.03% |
| Middleton | Strafford County | 1,768 | 877 | 891 | 21.83% | 11.54% | 33.37% |
| Milan | Coos County | 1,309 | 679 | 630 | 17.65% | 16.35% | 34.00% |
| Milford | Hillsborough County | 15,569 | 7,401 | 8,168 | 22.36% | 16.01% | 38.37% |
| Millsfield ship | Coos County | 13 | 9 | 4 | 0.00% | 30.77% | 30.77% |
| Milton | Strafford County | 4,643 | 2,296 | 2,347 | 21.04% | 16.17% | 37.22% |
| Monroe | Grafton County | 958 | 514 | 444 | 24.63% | 20.35% | 44.99% |
| Mont Vernon | Hillsborough County | 2,533 | 1,262 | 1,271 | 21.28% | 14.61% | 35.89% |
| Moultonborough | Carroll County | 4,077 | 1,995 | 2,082 | 18.03% | 26.88% | 44.91% |
| Nashua | Hillsborough County | 88,606 | 43,202 | 45,404 | 19.38% | 15.12% | 34.50% |
| Nelson | Cheshire County | 621 | 328 | 293 | 15.78% | 22.38% | 38.16% |
| New Boston | Hillsborough County | 5,616 | 2,773 | 2,843 | 25.57% | 10.33% | 35.90% |
| New Castle | Rockingham County | 780 | 372 | 408 | 15.13% | 42.31% | 57.44% |
| New Durham | Strafford County | 2,699 | 1,350 | 1,349 | 21.71% | 19.12% | 40.83% |
| New Hampton | Belknap County | 2,304 | 1,135 | 1,169 | 17.27% | 23.83% | 41.10% |
| New Ipswich | Hillsborough County | 5,284 | 2,935 | 2,349 | 25.32% | 9.77% | 35.09% |
| New London | Merrimack County | 4,490 | 1,960 | 2,530 | 12.00% | 31.80% | 43.81% |
| Newbury | Merrimack County | 1,900 | 955 | 945 | 13.84% | 29.32% | 43.16% |
| Newfields | Rockingham County | 1,670 | 796 | 874 | 25.99% | 11.50% | 37.49% |
| Newington | Rockingham County | 798 | 417 | 381 | 12.16% | 24.06% | 36.22% |
| Newmarket | Rockingham County | 9,038 | 4,525 | 4,513 | 17.39% | 14.63% | 32.02% |
| Newport | Sullivan County | 6,386 | 3,293 | 3,093 | 17.66% | 20.67% | 38.33% |
| Newton | Rockingham County | 4,886 | 2,495 | 2,391 | 19.93% | 13.88% | 33.81% |
| North Hampton | Rockingham County | 4,453 | 2,048 | 2,405 | 18.37% | 22.12% | 40.49% |
| Northfield | Merrimack County | 4,866 | 2,482 | 2,384 | 26.76% | 13.79% | 40.55% |
| Northumberland | Coos County | 2,271 | 1,144 | 1,127 | 22.28% | 17.88% | 40.16% |
| Northwood | Rockingham County | 4,305 | 2,073 | 2,232 | 18.79% | 17.44% | 36.24% |
| Nottingham | Rockingham County | 5,004 | 2,333 | 2,671 | 21.62% | 14.31% | 35.93% |
| Odell ship | Coos County | 0 | 0 | 0 | 0.00% | 0.00% | 0.00% |
| Orange | Grafton County | 248 | 125 | 123 | 10.48% | 29.03% | 39.52% |
| Orford | Grafton County | 1,507 | 663 | 844 | 15.46% | 16.72% | 32.18% |
| Ossipee | Carroll County | 4,303 | 2,120 | 2,183 | 14.06% | 25.82% | 39.88% |
| Pelham | Hillsborough County | 13,596 | 6,564 | 7,032 | 22.31% | 15.66% | 37.97% |
| Pembroke | Merrimack County | 7,172 | 3,485 | 3,687 | 19.73% | 14.21% | 33.94% |
| Peterborough | Hillsborough County | 6,524 | 3,169 | 3,355 | 14.71% | 26.39% | 41.11% |
| Piermont | Grafton County | 807 | 400 | 407 | 15.99% | 22.92% | 38.91% |
| Pinkhams grant | Coos County | 11 | 9 | 2 | 0.00% | 0.00% | 0.00% |
| Pittsburg | Coos County | 721 | 385 | 336 | 8.46% | 37.59% | 46.05% |
| Pittsfield | Merrimack County | 4,123 | 2,003 | 2,120 | 24.45% | 13.36% | 37.81% |
| Plainfield | Sullivan County | 2,415 | 1,233 | 1,182 | 18.30% | 16.89% | 35.20% |
| Plaistow | Rockingham County | 7,677 | 3,613 | 4,064 | 19.11% | 14.69% | 33.80% |
| Plymouth | Grafton County | 6,731 | 3,270 | 3,461 | 15.45% | 14.86% | 30.31% |
| Portsmouth | Rockingham County | 21,778 | 10,758 | 11,020 | 15.62% | 18.15% | 33.77% |
| Randolph | Coos County | 398 | 205 | 193 | 6.53% | 35.68% | 42.21% |
| Raymond | Rockingham County | 10,389 | 5,459 | 4,930 | 22.53% | 13.68% | 36.21% |
| Richmond | Cheshire County | 1,182 | 562 | 620 | 19.29% | 13.87% | 33.16% |
| Rindge | Cheshire County | 6,106 | 3,065 | 3,041 | 20.54% | 13.38% | 33.92% |
| Rochester | Strafford County | 30,661 | 15,226 | 15,435 | 20.75% | 17.90% | 38.65% |
| Rollinsford | Strafford County | 2,555 | 1,216 | 1,339 | 19.37% | 14.76% | 34.13% |
| Roxbury | Cheshire County | 194 | 101 | 93 | 14.43% | 15.46% | 29.90% |
| Rumney | Grafton County | 1,486 | 716 | 770 | 16.62% | 17.70% | 34.32% |
| Rye | Rockingham County | 5,434 | 2,719 | 2,715 | 16.62% | 30.20% | 46.82% |
| Salem | Rockingham County | 29,133 | 14,366 | 14,767 | 18.02% | 18.04% | 36.06% |
| Salisbury | Merrimack County | 1,262 | 641 | 621 | 17.67% | 20.92% | 38.59% |
| Sanbornton | Belknap County | 2,976 | 1,615 | 1,361 | 17.84% | 18.15% | 35.99% |
| Sandown | Rockingham County | 6,350 | 3,103 | 3,247 | 21.94% | 11.09% | 33.02% |
| Sandwich | Carroll County | 1,321 | 638 | 683 | 11.51% | 34.44% | 45.95% |
| Sargents purchase | Coos County | 24 | 0 | 24 | 0.00% | 0.00% | 0.00% |
| Seabrook | Rockingham County | 8,846 | 4,372 | 4,474 | 14.03% | 23.03% | 37.06% |
| Second College grant | Coos County | 0 | 0 | 0 | 0.00% | 0.00% | 0.00% |
| Sharon | Hillsborough County | 372 | 182 | 190 | 16.94% | 27.96% | 44.89% |
| Shelburne | Coos County | 421 | 218 | 203 | 14.01% | 33.02% | 47.03% |
| Somersworth | Strafford County | 11,883 | 5,658 | 6,225 | 21.22% | 13.39% | 34.61% |
| South Hampton | Rockingham County | 780 | 360 | 420 | 19.87% | 20.26% | 40.13% |
| Springfield | Sullivan County | 1,110 | 573 | 537 | 16.58% | 24.32% | 40.90% |
| Stark | Coos County | 564 | 285 | 279 | 13.48% | 31.74% | 45.21% |
| Stewarts | Coos County | 889 | 456 | 433 | 12.37% | 39.82% | 52.19% |
| Stoddard | Cheshire County | 1,229 | 598 | 631 | 20.18% | 22.21% | 42.39% |
| Strafford | Strafford County | 4,118 | 1,969 | 2,149 | 20.88% | 14.96% | 35.84% |
| Stratford | Coos County | 672 | 349 | 323 | 22.32% | 19.64% | 41.96% |
| Stratham | Rockingham County | 7,418 | 3,911 | 3,507 | 22.72% | 15.41% | 38.12% |
| Success ship | Coos County | 0 | 0 | 0 | 0.00% | 0.00% | 0.00% |
| Sugar Hill | Grafton County | 651 | 282 | 369 | 18.43% | 29.19% | 47.62% |
| Sullivan | Cheshire County | 760 | 365 | 395 | 21.71% | 17.11% | 38.82% |
| Sunapee | Sullivan County | 3,432 | 1,818 | 1,614 | 20.40% | 22.00% | 42.40% |
| Surry | Cheshire County | 884 | 421 | 463 | 22.06% | 19.57% | 41.63% |
| Sutton | Merrimack County | 2,074 | 1,049 | 1,025 | 24.78% | 18.90% | 43.68% |
| Swanzey | Cheshire County | 7,195 | 3,504 | 3,691 | 16.80% | 18.11% | 34.91% |
| Tamworth | Carroll County | 2,959 | 1,543 | 1,416 | 16.66% | 18.11% | 34.78% |
| Temple | Hillsborough County | 1,311 | 687 | 624 | 13.27% | 21.21% | 34.48% |
| Thompson and Meserves purchase | Coos County | 0 | 0 | 0 | 0.00% | 0.00% | 0.00% |
| Thornton | Grafton County | 2,511 | 1,339 | 1,172 | 16.49% | 28.00% | 44.48% |
| Tilton | Belknap County | 3,557 | 1,902 | 1,655 | 16.56% | 21.51% | 38.07% |
| Troy | Cheshire County | 2,015 | 975 | 1,040 | 19.11% | 15.29% | 34.39% |
| Tuftonboro | Carroll County | 2,283 | 1,046 | 1,237 | 15.46% | 32.72% | 48.18% |
| Unity | Sullivan County | 1,420 | 682 | 738 | 5.85% | 32.54% | 38.38% |
| Wakefield | Carroll County | 5,016 | 2,609 | 2,407 | 14.61% | 24.10% | 38.72% |
| Walpole | Cheshire County | 3,875 | 2,035 | 1,840 | 18.14% | 19.23% | 37.37% |
| Warner | Merrimack County | 2,912 | 1,380 | 1,532 | 20.12% | 17.55% | 37.67% |
| Warren | Grafton County | 977 | 522 | 455 | 18.01% | 22.21% | 40.23% |
| Washington | Sullivan County | 1,164 | 622 | 542 | 14.09% | 22.94% | 37.03% |
| Waterville Valley | Grafton County | 183 | 107 | 76 | 15.85% | 33.88% | 49.73% |
| Weare | Hillsborough County | 9,011 | 4,327 | 4,684 | 24.28% | 8.77% | 33.05% |
| Webster | Merrimack County | 1,790 | 919 | 871 | 16.37% | 17.37% | 33.74% |
| Wentworth | Grafton County | 876 | 443 | 433 | 15.18% | 26.94% | 42.12% |
| Wentworth location | Coos County | 28 | 17 | 11 | 0.00% | 53.57% | 53.57% |
| Westmoreland | Cheshire County | 1,704 | 805 | 899 | 15.02% | 23.47% | 38.50% |
| Whitefield | Coos County | 2,249 | 1,141 | 1,108 | 20.10% | 25.26% | 45.35% |
| Wilmot | Merrimack County | 1,669 | 774 | 895 | 16.36% | 22.47% | 38.83% |
| Wilton | Hillsborough County | 3,731 | 1,944 | 1,787 | 16.32% | 20.13% | 36.45% |
| Winchester | Cheshire County | 4,222 | 1,945 | 2,277 | 21.96% | 19.23% | 41.19% |
| Windham | Rockingham County | 14,508 | 7,334 | 7,174 | 25.75% | 13.87% | 39.62% |
| Windsor | Hillsborough County | 270 | 161 | 109 | 18.52% | 12.96% | 31.48% |
| Wolfeboro | Carroll County | 6,278 | 3,114 | 3,164 | 13.62% | 35.65% | 49.27% |
| Woodstock | Grafton County | 1,094 | 524 | 570 | 22.12% | 19.29% | 41.41% |
ACS 2018 – Income, Poverty, Unemployment
| Town | Population | Square Miles | Population Density | Housing Units | Median Household Income | Poverty Rate | Unemployment Rate |
|---|---|---|---|---|---|---|---|
| Acworth | 930 | 39.1 | 23 | 582 | $60,795 | 5.6% | 0.6% |
| Albany | 772 | 75.7 | 10 | 520 | $54,375 | 26.2% | 5.4% |
| Alexandria | 2,005 | 43.4 | 37 | 998 | $67,500 | 11.4% | 6.8% |
| Allenstown | 4,370 | 20.6 | 210 | 1,877 | $56,046 | 9.4% | 6.3% |
| Alstead | 1,736 | 39.4 | 49 | 910 | $57,011 | 18.9% | 1.4% |
| Alton | 5,298 | 83.2 | 63 | 4,515 | $83,378 | 4.4% | 6.9% |
| Amherst | 11,310 | 34.4 | 325 | 4,209 | $135,234 | 1.4% | 3.8% |
| Andover | 2,799 | 41 | 58 | 1,267 | $74,830 | 7.5% | 3.5% |
| Antrim | 2,680 | 36.5 | 72 | 1,283 | $69,750 | 8.1% | 4.0% |
| Ashland | 2,142 | 11.8 | 176 | 1,315 | $46,534 | 16.4% | 4.7% |
| Atkinson | 0 | 19.3 | 0 | 0 | $0 | 0.0% | 0.0% |
| Atkinson | 6,897 | 11.3 | 595 | 2,888 | $113,322 | 1.7% | 2.6% |
| Auburn | 5,385 | 28.8 | 172 | 2,040 | $115,139 | 1.8% | 3.4% |
| Barnstead | 4,624 | 44.9 | 102 | 2,399 | $79,423 | 4.9% | 5.3% |
| Barrington | 8,979 | 48.6 | 176 | 3,737 | $86,755 | 5.2% | 3.0% |
| Bartlett | 2,761 | 75.2 | 37 | 4,484 | $52,807 | 7.3% | 5.0% |
| Bath | 914 | 38.6 | 28 | 590 | $53,988 | 6.1% | 5.3% |
| Beans Grant | 0 | 9.7 | 0 | 0 | $0 | 0.0% | 0.0% |
| Beans Purchase | 0 | 65.3 | 0 | 0 | $0 | 0.0% | 0.0% |
| Bedford | 22,388 | 33.1 | 641 | 8,129 | $131,986 | 1.8% | 3.4% |
| Belmont | 7,298 | 31.9 | 231 | 3,617 | $69,286 | 8.1% | 3.2% |
| Bennington | 1,402 | 11.6 | 127 | 708 | $61,364 | 5.4% | 2.3% |
| Benton | 395 | 48.4 | 8 | 163 | $50,893 | 4.5% | 2.1% |
| Berlin | 10,382 | 62.2 | 162 | 4,765 | $38,315 | 19.8% | 8.2% |
| Bethlehem | 2,568 | 91 | 28 | 1,504 | $53,190 | 13.3% | 3.5% |
| Boscawen | 4,029 | 25.5 | 155 | 1,497 | $71,566 | 7.6% | 4.0% |
| Bow | 7,816 | 28.5 | 263 | 2,828 | $117,961 | 2.6% | 1.6% |
| Bradford | 1,633 | 35.9 | 46 | 872 | $64,167 | 5.4% | 2.7% |
| Brentwood | 4,712 | 17 | 264 | 1,595 | $116,864 | 2.5% | 4.5% |
| Bridgewater | 1,205 | 21.7 | 50 | 1,017 | $65,662 | 8.8% | 6.4% |
| Bristol | 3,063 | 21.9 | 139 | 2,454 | $53,286 | 12.5% | 3.9% |
| Brookfield | 709 | 23.2 | 31 | 352 | $84,464 | 2.0% | 5.4% |
| Brookline | 5,298 | 20.2 | 247 | 1,723 | $138,092 | 1.1% | 2.9% |
| Cambridge | 0 | 51.7 | 0 | 33 | $0 | 0.0% | 0.0% |
| Campton | 3,313 | 52.5 | 63 | 2,356 | $68,182 | 4.6% | 0.8% |
| Canaan | 3,917 | 55.1 | 71 | 1,886 | $75,066 | 7.5% | 2.5% |
| Candia | 3,925 | 30.6 | 128 | 1,525 | $102,083 | 4.3% | 2.9% |
| Canterbury | 2,335 | 44.7 | 53 | 1,055 | $85,729 | 3.3% | 3.1% |
| Carroll | 740 | 50.3 | 15 | 900 | $59,653 | 10.1% | 2.6% |
| Center | 995 | 16.2 | 67 | 783 | $66,750 | 7.5% | 0.8% |
| Chandlers Purchase | 0 | 2.1 | 0 | 0 | $0 | 0.0% | 0.0% |
| Charlestown | 5,019 | 38 | 134 | 2,304 | $48,911 | 15.2% | 6.8% |
| Chatham | 370 | 57.3 | 6 | 260 | $63,906 | 9.1% | 5.4% |
| Chester | 5,039 | 26.1 | 183 | 1,746 | $134,514 | 3.2% | 3.3% |
| Chesterfield | 3,576 | 47.5 | 76 | 1,902 | $71,763 | 1.3% | 4.8% |
| Chichester | 2,625 | 21.3 | 118 | 1,021 | $89,167 | 5.6% | 2.5% |
| Claremont | 13,016 | 44.1 | 303 | 6,167 | $48,099 | 14.3% | 3.3% |
| Clarksville | 339 | 62.4 | 4 | 473 | $41,023 | 11.2% | 8.4% |
| Colebrook | 2,008 | 40.7 | 57 | 1,493 | $42,750 | 14.5% | 4.2% |
| Columbia | 602 | 61.1 | 12 | 513 | $44,432 | 12.8% | 5.7% |
| Concord | 43,040 | 67.2 | 635 | 18,378 | $62,967 | 10.1% | 4.3% |
| Conway | 10,078 | 71.7 | 141 | 7,131 | $60,323 | 15.5% | 1.9% |
| Cornish | 1,813 | 42.6 | 38 | 820 | $81,989 | 10.1% | 2.3% |
| County Subdivisions Not Defined | 0 | 43.6 | 0 | 0 | $0 | 0.0% | 0.0% |
| Crawfords | 0 | 8.2 | 0 | 0 | $0 | 0.0% | 0.0% |
| Croydon | 972 | 37.5 | 20 | 456 | $74,038 | 7.9% | 3.2% |
| Cutts Grant | 0 | 11.3 | 0 | 0 | $0 | 0.0% | 0.0% |
| Dalton | 982 | 28.1 | 35 | 592 | $55,240 | 8.9% | 9.6% |
| Danbury | 1,177 | 38 | 31 | 663 | $65,526 | 3.5% | 5.1% |
| Danville | 4,515 | 11.8 | 371 | 1,649 | $87,708 | 2.1% | 5.9% |
| Deerfield | 4,463 | 52.1 | 82 | 1,905 | $100,469 | 5.6% | 1.7% |
| Deering | 1,958 | 31.2 | 61 | 964 | $67,500 | 6.9% | 2.8% |
| Derry | 33,515 | 36.3 | 912 | 13,776 | $71,725 | 7.9% | 5.8% |
| Dixs | 0 | 20.1 | 0 | 10 | $0 | 0.0% | 0.0% |
| Dixville | 11 | 49.2 | 0 | 30 | $0 | 66.7% | 25.0% |
| Dorchester | 362 | 45.2 | 8 | 210 | $57,656 | 8.0% | 5.0% |
| Dover | 31,316 | 29 | 1032 | 13,989 | $70,757 | 10.1% | 3.9% |
| Dublin | 1,487 | 29 | 55 | 785 | $79,167 | 5.0% | 3.5% |
| Dummer | 271 | 49.2 | 6 | 265 | $42,917 | 8.9% | 7.0% |
| Dunbarton | 2,811 | 31.3 | 88 | 1,025 | $106,800 | 1.0% | 2.0% |
| Durham | 16,440 | 24.8 | 591 | 3,885 | $75,066 | 26.8% | 4.7% |
| East Kingstown | 2,445 | 10 | 236 | 932 | $98,882 | 5.6% | 4.0% |
| Easton | 259 | 31.1 | 8 | 208 | $82,708 | 1.2% | 3.1% |
| Eaton | 289 | 25.6 | 15 | 285 | $69,375 | 7.6% | 2.9% |
| Effingham | 1,537 | 39.9 | 37 | 967 | $58,466 | 10.1% | 6.0% |
| Ellsworth | 61 | 21.5 | 4 | 96 | $50,250 | 1.6% | 0.0% |
| Enfield | 4,570 | 43.2 | 106 | 2,706 | $79,327 | 4.2% | 1.6% |
| Epping | 6,945 | 26.2 | 245 | 2,873 | $77,235 | 8.9% | 3.8% |
| Epsom | 4,713 | 34.6 | 132 | 2,002 | $68,910 | 3.3% | 2.4% |
| Errol | 234 | 69.4 | 4 | 489 | $43,125 | 15.0% | 6.5% |
| Ervings Location | 0 | 3.8 | 0 | 0 | $0 | 0.0% | 0.0% |
| Exeter | 14,921 | 20 | 717 | 6,819 | $77,766 | 5.5% | 3.8% |
| Farmington | 6,884 | 36.9 | 184 | 3,068 | $62,596 | 9.0% | 2.8% |
| Fitzwilliam | 2,351 | 36 | 66 | 1,225 | $62,000 | 5.0% | 3.8% |
| Francestown | 1,650 | 30.4 | 51 | 847 | $101,714 | 2.7% | 2.8% |
| Franconia | 1,025 | 65.8 | 17 | 898 | $73,000 | 3.3% | 4.9% |
| Franklin | 8,586 | 29.2 | 291 | 4,309 | $50,750 | 11.7% | 4.2% |
| Freedom | 1,353 | 37.9 | 39 | 1,896 | $63,304 | 9.5% | 5.8% |
| Fremont | 4,667 | 17.4 | 246 | 1,774 | $97,330 | 2.6% | 4.7% |
| Gilford | 7,139 | 53.5 | 133 | 5,177 | $80,563 | 7.9% | 2.3% |
| Gilmanton | 3,738 | 59.6 | 63 | 2,292 | $70,956 | 7.2% | 6.5% |
| Gilsum | 732 | 16.7 | 49 | 343 | $70,652 | 7.8% | 5.8% |
| Goffstown | 18,062 | 37.6 | 469 | 6,473 | $85,529 | 6.4% | 3.8% |
| Gorham | 2,636 | 32.3 | 88 | 1,532 | $60,556 | 3.7% | 2.7% |
| Goshen | 772 | 22.5 | 36 | 438 | $65,000 | 9.7% | 1.9% |
| Grafton | 1,220 | 42.4 | 32 | 784 | $54,792 | 8.4% | 9.4% |
| Grantham | 2,941 | 28 | 106 | 1,769 | $91,103 | 1.4% | 1.7% |
| Greenfield | 1,765 | 26.8 | 65 | 760 | $78,750 | 6.4% | 3.7% |
| Greenland | 3,953 | 13.3 | 266 | 1,550 | $115,987 | 4.7% | 2.3% |
| Greens Grant | 12 | 3.7 | 0 | 0 | $0 | 75.0% | 0.0% |
| Greenville | 2,049 | 6.9 | 306 | 1,019 | $54,896 | 5.7% | 2.6% |
| Groton | 530 | 40.8 | 15 | 408 | $53,750 | 15.7% | 2.9% |
| Hadleys Purchase | 0 | 7.4 | 0 | 0 | $0 | 0.0% | 0.0% |
| Hale's Location | 167 | 2.5 | 48 | 97 | $76,250 | 8.4% | 0.0% |
| Hampstead | 8,625 | 14.1 | 606 | 3,747 | $89,688 | 6.5% | 5.6% |
| Hampton | 2,358 | 12.7 | 177 | 948 | $82,485 | 4.9% | 2.4% |
| Hampton Falls | 15,452 | 14.6 | 1024 | 9,741 | $131,382 | 3.5% | 1.1% |
| Hancock | 1,785 | 31.3 | 53 | 930 | $71,250 | 1.5% | 5.0% |
| Hanover | 11,512 | 50.1 | 225 | 3,429 | $133,672 | 8.2% | 2.5% |
| Harrisville | 921 | 20.2 | 48 | 758 | $72,833 | 5.9% | 3.0% |
| Hart's Location | 56 | 18.8 | 2 | 65 | $68,750 | 0.0% | 0.0% |
| Haverhill | 4,616 | 52.4 | 90 | 2,386 | $50,443 | 8.1% | 3.4% |
| Hebron | 580 | 19.3 | 31 | 634 | $67,500 | 9.5% | 5.2% |
| Henniker | 4,950 | 44.8 | 108 | 2,028 | $86,696 | 8.1% | 2.4% |
| Hill | 931 | 26.7 | 41 | 497 | $78,030 | 6.9% | 3.2% |
| Hillsborough | 5,999 | 44.7 | 134 | 3,026 | $72,863 | 3.0% | 5.1% |
| Hinsdale | 3,917 | 22.7 | 179 | 1,944 | $61,003 | 13.3% | 4.5% |
| Holderness | 2,336 | 35.7 | 59 | 1,553 | $68,977 | 10.5% | 2.0% |
| Hollis | 7,880 | 32.3 | 238 | 2,995 | $132,500 | 1.2% | 5.3% |
| Hooksett | 14,221 | 37.1 | 362 | 5,250 | $83,864 | 4.6% | 4.0% |
| Hopkinton | 5,670 | 45.1 | 124 | 2,414 | $97,014 | 4.5% | 5.2% |
| Hudson | 25,185 | 29.3 | 836 | 9,325 | $96,224 | 4.7% | 4.2% |
| Jackson | 966 | 66.8 | 12 | 1,037 | $70,417 | 11.4% | 4.1% |
| Jaffrey | 5,307 | 40.2 | 136 | 2,510 | $61,333 | 12.4% | 2.7% |
| Jefferson | 941 | 50.3 | 22 | 662 | $59,107 | 4.6% | 3.1% |
| Keene | 23,165 | 37.4 | 627 | 10,089 | $56,307 | 14.1% | 4.6% |
| Kensington | 2,326 | 12 | 177 | 900 | $115,625 | 4.0% | 3.1% |
| Kilkenny | 0 | 25.7 | 0 | 0 | $0 | 0.0% | 0.0% |
| Kingston | 6,210 | 21 | 286 | 2,732 | $97,745 | 6.3% | 4.0% |
| Laconia | 16,342 | 26.1 | 611 | 10,072 | $57,046 | 12.1% | 5.2% |
| Lancaster | 3,310 | 51.1 | 69 | 1,534 | $54,844 | 6.5% | 4.9% |
| Landaff | 450 | 28.5 | 15 | 242 | $51,563 | 19.6% | 12.8% |
| Langdon | 829 | 16.3 | 42 | 339 | $85,139 | 15.6% | 3.5% |
| Lebanon | 13,619 | 41.3 | 319 | 6,602 | $68,675 | 11.1% | 1.9% |
| Lee | 4,424 | 20.2 | 214 | 1,966 | $91,600 | 1.4% | 1.4% |
| Lempster | 906 | 32.7 | 35 | 668 | $64,318 | 7.8% | 2.0% |
| Lincoln | 1,229 | 131 | 13 | 3,141 | $57,656 | 11.5% | 0.8% |
| Lisbon | 1,631 | 26.7 | 60 | 819 | $53,636 | 11.6% | 8.6% |
| Litchfield | 8,538 | 15.3 | 540 | 3,019 | $97,051 | 3.3% | 4.7% |
| Littleton | 5,927 | 54 | 110 | 3,293 | $40,125 | 18.9% | 3.8% |
| Livermore | 0 | 63.9 | 0 | 20 | $0 | 0.0% | 0.0% |
| Londonderry | 25,529 | 42.1 | 573 | 9,491 | $101,500 | 2.9% | 3.3% |
| Loudon | 5,488 | 46.7 | 114 | 2,247 | $69,784 | 7.3% | 10.2% |
| Low and Burbanks Grant | 0 | 26.1 | 0 | 0 | $0 | 0.0% | 0.0% |
| Lyman | 651 | 28.7 | 19 | 403 | $58,672 | 6.8% | 5.4% |
| Lyme | 1,682 | 55 | 31 | 772 | $106,786 | 2.6% | 1.5% |
| Lyndeborough | 1,703 | 30.6 | 55 | 740 | $90,938 | 3.6% | 4.6% |
| Madbury | 1,867 | 12.2 | 145 | 633 | $113,750 | 2.6% | 2.2% |
| Madison | 2,545 | 40.9 | 61 | 1,985 | $65,278 | 8.3% | 7.4% |
| Manchester | 111,657 | 34.9 | 3136 | 48,969 | $58,227 | 14.8% | 5.1% |
| Marlborough | 2,271 | 20.6 | 100 | 1,005 | $60,676 | 7.9% | 0.0% |
| Marlow | 813 | 26.4 | 28 | 447 | $59,211 | 11.6% | 3.4% |
| Martins Location | 0 | 3.8 | 0 | 0 | $0 | 0.0% | 0.0% |
| Mason | 1,540 | 24 | 58 | 622 | $106,833 | 4.2% | 3.2% |
| Meredith | 6,369 | 54.6 | 114 | 4,952 | $69,393 | 11.4% | 4.4% |
| Merrimack | 25,815 | 33.4 | 763 | 10,264 | $103,043 | 3.7% | 3.8% |
| Middleton | 1,768 | 18.5 | 96 | 796 | $73,990 | 8.3% | 4.5% |
| Milan | 1,309 | 64.4 | 21 | 858 | $54,563 | 8.6% | 3.0% |
| Milford | 15,569 | 25.5 | 594 | 6,638 | $77,813 | 3.5% | 5.0% |
| Millsfield | 13 | 45.2 | 1 | 80 | $0 | 0.0% | 0.0% |
| Milton | 4,643 | 34.3 | 134 | 2,053 | $69,375 | 3.3% | 5.2% |
| Monroe | 958 | 23.8 | 33 | 394 | $68,438 | 4.5% | 5.5% |
| Mont | 2,533 | 16.9 | 142 | 923 | $113,125 | 4.3% | 2.7% |
| Moultonborough | 4,077 | 75.1 | 54 | 4,888 | $72,071 | 6.2% | 2.7% |
| Nashua | 88,606 | 31.7 | 2726 | 37,922 | $73,022 | 9.9% | 4.8% |
| Nelson | 621 | 23.3 | 31 | 459 | $78,000 | 13.0% | 0.6% |
| New Boston | 5,616 | 43.2 | 123 | 1,983 | $108,889 | 1.8% | 1.6% |
| New Castle | 780 | 2.3 | 426 | 519 | $107,083 | 0.9% | 0.9% |
| New Durham | 2,699 | 43.8 | 60 | 1,649 | $80,787 | 5.7% | 3.9% |
| New Hampton | 2,304 | 38.4 | 56 | 1,151 | $67,708 | 9.0% | 5.1% |
| New Ipswich | 5,284 | 33 | 154 | 2,077 | $82,418 | 3.6% | 4.0% |
| New London | 4,490 | 25.4 | 173 | 2,328 | $84,145 | 6.9% | 3.5% |
| Newbury | 1,900 | 38.1 | 54 | 1,675 | $93,920 | 1.5% | 0.4% |
| Newfields | 1,670 | 7.3 | 231 | 576 | $146,389 | 3.0% | 1.2% |
| Newington | 798 | 12.4 | 61 | 344 | $98,958 | 4.4% | 2.1% |
| Newmarket | 9,038 | 14.2 | 630 | 4,211 | $75,290 | 5.9% | 2.8% |
| Newport | 6,386 | 43.6 | 149 | 2,920 | $55,898 | 14.3% | 5.6% |
| Newton | 4,886 | 10 | 462 | 1,910 | $110,787 | 4.3% | 4.1% |
| North Hampton | 4,453 | 14.4 | 299 | 1,934 | $103,649 | 5.2% | 2.4% |
| Northfield | 4,866 | 28.9 | 167 | 1,942 | $63,444 | 3.2% | 3.8% |
| Northumberland | 2,271 | 36.8 | 62 | 1,159 | $43,828 | 8.3% | 4.8% |
| Northwood | 4,305 | 30.2 | 140 | 2,168 | $89,663 | 4.3% | 2.6% |
| Nottingham | 5,004 | 48.4 | 99 | 1,922 | $94,018 | 4.4% | 2.6% |
| Odell | 0 | 45 | 0 | 71 | $0 | 0.0% | 0.0% |
| Orange | 248 | 23.1 | 14 | 150 | $59,375 | 6.9% | 5.2% |
| Orford | 1,507 | 47.9 | 26 | 675 | $83,594 | 6.8% | 3.4% |
| Ossipee | 4,303 | 75.3 | 58 | 3,154 | $47,083 | 14.3% | 5.0% |
| Pelham | 13,596 | 26.9 | 480 | 4,907 | $103,940 | 3.9% | 2.8% |
| Pembroke | 7,172 | 22.8 | 312 | 2,858 | $84,767 | 5.7% | 0.6% |
| Peterborough | 6,524 | 38.4 | 164 | 3,233 | $82,721 | 7.2% | 3.6% |
| Piermont | 807 | 39.8 | 20 | 468 | $77,222 | 3.6% | 4.8% |
| Pinkhams Grant | 11 | 3.8 | 2 | 0 | $0 | 72.7% | 0.0% |
| Pittsburg | 721 | 291.3 | 3 | 1,821 | $46,250 | 5.0% | 2.2% |
| Pittsfield | 4,123 | 24.3 | 169 | 1,847 | $51,998 | 16.1% | 8.8% |
| Plainfield | 2,415 | 53 | 45 | 1,049 | $84,875 | 4.4% | 1.5% |
| Plaistow | 7,677 | 10.6 | 718 | 3,235 | $82,904 | 3.9% | 5.9% |
| Plymouth | 6,731 | 28.7 | 244 | 2,750 | $46,538 | 13.0% | 6.1% |
| Portsmouth | 21,778 | 16.8 | 1235 | 10,359 | $78,027 | 6.1% | 2.5% |
| Randolph | 398 | 47.1 | 7 | 375 | $84,063 | 3.3% | 3.7% |
| Raymond | 10,389 | 29.6 | 342 | 4,346 | $76,713 | 8.1% | 3.8% |
| Richmond | 1,182 | 37.7 | 31 | 489 | $64,926 | 11.9% | 7.4% |
| Rindge | 6,106 | 39.8 | 151 | 2,356 | $77,625 | 6.4% | 2.5% |
| Rochester | 30,661 | 45.4 | 655 | 13,461 | $58,427 | 12.0% | 4.3% |
| Rollinsford | 2,555 | 7.6 | 334 | 1,106 | $77,277 | 5.0% | 3.8% |
| Roxbury | 194 | 12.2 | 19 | 92 | $86,667 | 2.6% | 8.1% |
| Rumney | 1,486 | 42.6 | 35 | 958 | $57,736 | 13.4% | 2.6% |
| Rye | 5,434 | 36.8 | 144 | 3,104 | $103,482 | 3.6% | 1.4% |
| Salem | 29,133 | 25.9 | 1111 | 12,011 | $83,343 | 4.4% | 4.3% |
| Salisbury | 1,262 | 39.8 | 35 | 595 | $80,625 | 4.7% | 2.7% |
| Sanbornton | 2,976 | 49.6 | 60 | 1,629 | $84,022 | 4.5% | 7.2% |
| Sandown | 6,350 | 14.4 | 415 | 2,334 | $106,270 | 2.3% | 3.0% |
| Sandwich | 1,321 | 94.1 | 14 | 964 | $78,438 | 6.5% | 5.1% |
| Sargents Purchase | 24 | 25.9 | 0 | 0 | $0 | 100.0% | 0.0% |
| Seabrook | 8,846 | 9.7 | 896 | 4,849 | $67,430 | 4.9% | 5.5% |
| Second College Grant | 0 | 41.8 | 0 | 29 | $0 | 0.0% | 0.0% |
| Sharon | 372 | 15.7 | 22 | 202 | $72,292 | 3.5% | 2.5% |
| Shelburne | 421 | 48.8 | 8 | 248 | $65,673 | 2.9% | 3.6% |
| Somersworth | 11,883 | 10 | 1177 | 5,356 | $64,786 | 8.5% | 6.0% |
| South Hampton | 780 | 8 | 101 | 382 | $107,500 | 5.3% | 2.9% |
| Springfield | 1,110 | 44.5 | 29 | 688 | $79,762 | 5.7% | 7.5% |
| Stark | 564 | 59.7 | 9 | 483 | $46,528 | 14.3% | 10.1% |
| Stewartstown | 889 | 46.9 | 21 | 922 | $41,667 | 9.7% | 4.9% |
| Stoddard | 1,229 | 53.1 | 23 | 1,041 | $81,429 | 2.9% | 6.8% |
| Strafford | 4,118 | 51.2 | 78 | 1,803 | $95,298 | 2.5% | 3.0% |
| Stratford | 672 | 79.8 | 9 | 571 | $37,955 | 27.5% | 3.7% |
| Stratham | 7,418 | 15.5 | 468 | 2,955 | $113,833 | 1.1% | 2.7% |
| Success | 0 | 57 | 0 | 54 | $0 | 0.0% | 0.0% |
| Sugar Hill | 651 | 17.2 | 33 | 443 | $83,542 | 8.1% | 1.2% |
| Sullivan | 760 | 18.7 | 36 | 315 | $64,375 | 7.8% | 2.5% |
| Sunapee | 3,432 | 25.2 | 134 | 2,539 | $68,897 | 4.3% | 3.8% |
| Surry | 884 | 16 | 46 | 358 | $77,083 | 2.7% | 1.2% |
| Sutton | 2,074 | 43.3 | 42 | 1,098 | $92,688 | 3.4% | 1.2% |
| Swanzey | 7,195 | 45.3 | 159 | 3,169 | $62,226 | 5.9% | 3.5% |
| Tamworth | 2,959 | 60.6 | 47 | 2,073 | $41,947 | 10.3% | 0.0% |
| Temple | 1,311 | 22.5 | 61 | 601 | $90,238 | 7.5% | 4.8% |
| Thompson | 0 | 18.5 | 0 | 0 | $0 | 0.0% | 0.0% |
| Thornton | 2,511 | 50.7 | 49 | 2,091 | $63,848 | 1.9% | 3.7% |
| Tilton | 3,557 | 11.9 | 299 | 1,747 | $51,403 | 7.3% | 2.4% |
| Troy | 2,015 | 17.6 | 122 | 834 | $61,518 | 6.7% | 4.6% |
| Tuftonboro | 2,283 | 49.4 | 48 | 2,415 | $59,394 | 7.6% | 6.7% |
| Unity | 1,420 | 37.2 | 45 | 706 | $65,000 | 8.8% | 4.1% |
| Wakefield | 5,016 | 44.9 | 113 | 3,703 | $67,848 | 7.0% | 3.3% |
| Walpole | 3,875 | 36.7 | 102 | 1,758 | $83,564 | 3.2% | 3.5% |
| Warner | 2,912 | 55.5 | 51 | 1,385 | $72,829 | 7.9% | 0.8% |
| Warren | 977 | 49 | 18 | 635 | $50,962 | 18.2% | 7.8% |
| Washington | 1,164 | 47.7 | 24 | 1,164 | $77,083 | 3.0% | 2.0% |
| Waterville Valley | 183 | 64.5 | 4 | 1,187 | $106,250 | 0.0% | 0.0% |
| Weare | 9,011 | 60.1 | 146 | 3,693 | $86,944 | 6.2% | 1.4% |
| Webster | 1,790 | 28.8 | 65 | 904 | $83,385 | 4.6% | 2.7% |
| Wentworth | 28 | 19.3 | 2 | 106 | $0 | 0.0% | 29.4% |
| Wentworth Location | 876 | 42.1 | 22 | 556 | $65,703 | 11.5% | 1.2% |
| Westmoreland | 1,704 | 36.8 | 51 | 701 | $92,768 | 3.7% | 2.3% |
| Whitefield | 2,249 | 34.7 | 66 | 1,458 | $40,625 | 18.8% | 5.8% |
| Wilmot | 1,669 | 29.6 | 46 | 813 | $72,656 | 4.7% | 3.9% |
| Wilton | 3,731 | 25.7 | 143 | 1,830 | $76,395 | 2.3% | 4.5% |
| Winchester | 4,222 | 55.6 | 78 | 1,961 | $48,587 | 18.6% | 4.1% |
| Windham | 14,508 | 27.8 | 489 | 5,405 | $133,222 | 0.7% | 3.2% |
| Windsor | 270 | 8.5 | 26 | 141 | $61,000 | 9.6% | 11.8% |
| Wolfeboro | 6,278 | 58.4 | 107 | 4,646 | $61,914 | 2.7% | 3.5% |
| Woodstock | 1,094 | 59.3 | 23 | 1,392 | $57,667 | 8.1% | 1.0% |